
The prevalence of diabetes has been steadily increasing for the past 30 years and is growing most rapidly in low and middle-income countries. In 2016, the World Health Organization published the Global Report on Diabetes, which calls for action to reduce exposure to known risk factors and to improve access to and quality of care for people with diabetes1World Health Organization Global report on diabetes (who.int) (2016).
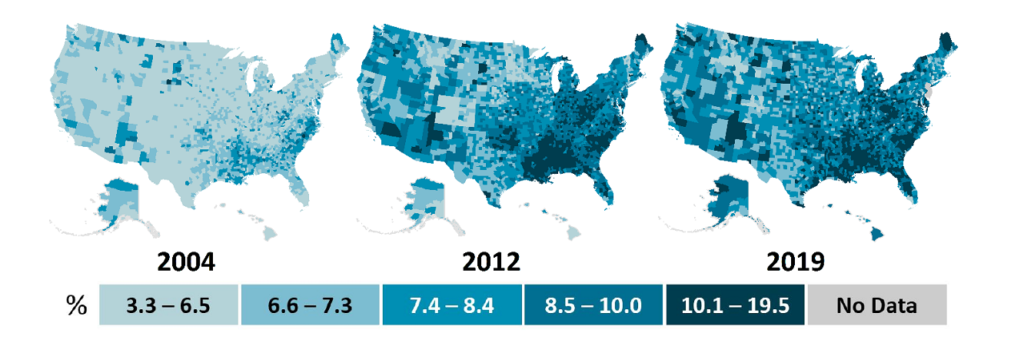
Even in high income countries the increases and forecasts are alarming. The CDC study National Diabetes Statistics Report found the 10% of Americans have diabetes (37 million) and 20% of those with diabetes don’t know they have it2National diabetes statistics report, 2020 : estimates of diabetes and its burden in the United States, National Center for Chronic Disease Prevention and Health Promotion (U.S.) https://stacks.cdc.gov/view/cdc/85309. The increase in county prevalence is shown below:
Studies have long been recognized that diabetes is strongly influenced by social determinants of health (SDOH) – the conditions in which people are born, grow, live, work, and age. The increase of public SDOH data provides opportunities for understanding the complex interactions between determinants and chronic diseases like diabetes. This article will show how machine learning techniques may be particularly useful in exploring diabetes factors with widely available public data. The article will show:
- How to select important features associated with diabetes from SDOH data that are widely available through national censuses and community surveys.
- Reasonably predicting the prevalence of diabetes at the regional level using machine learning techniques and public SDOH data.
- How important features associated with diabetes might be related to subjects researched in diabetes literature.
The source used to extract data, identify features and develop machine learning models is available on GitHub: SocialHealthAI/SDOH-Models.
Data Sources
Public SDOH data is available at the zip code, county and census tract levels. Some neighborhood data is available but only for specific metropolitan areas. Diabetes prevalence data is available at the state and county levels. For this analysis we will be using data at the county level.
The Agency for Healthcare Research and Quality (AHRQ) provides a repository for U.S. SDOH data sources. This includes survey results, economic data, environment metrics and SDOH indexes and consolidates the sources into a single data structure. The data sources are documented in AHRQ Social Determinants of Health (SDOH) Database Data Source Documentation. Measures useful for this analysis are ratios using population counts of counties on a yearly basis.
To help with extracting and preparing the data from the AHRQ repository you can use the data extract notebook: dataAHRQCountySDOH. The notebook extracts and cleans data and handles missing values. Any columns that are missing more than 30% are dropped and missing values are addressed using KNN Imputation.
The prevalence of diabetes at the county level is based on CMS Chronic Disease Data. Prevalence is based on the number of Medicare beneficiaries submitting a diabetes claim in a given year. To help with extracting and preparing CMS chronic disease data you can use the dataCMSChronic notebook.
Years 2015, 2016 and 2017 are used to determine important features and to develop models. Data from 2018 was held in reserve to measure model performance on future, unseen data.
Feature Selection
The AHRQ repository has over one thousand SDOH metrics. In regression analysis, too many features can cause the model to overfit the data. When a regression model is overfit, the coefficients represent the noise rather than the genuine relationships in the population. To reduce the number of features, the important features for predicting diabetes prevalence are identified using Random Forest Regression. The top 30 features are shown below.
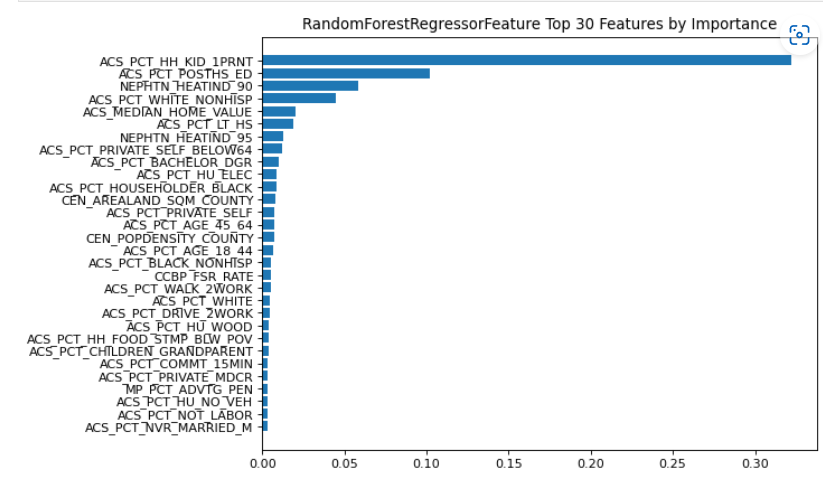
The majority of the features selected are from the American Community Survey (ACS). The ACS is a U.S. Census Bureau nationwide survey of social, economic, housing, and demographic data. The metrics are defined in AHRQ Social Determinants of Health (SDOH) Database Data Source Documentation and a discussion of the metrics follows in Analysis below.
The important features were also analyzed using Mutual Information Regression. However, feature importance identified by Random Forest Regression gave the best model performance. Helper notebooks for feature selection are available: features_RandomForestReg and features_MutualInformationReg.
Model Development
Using county prevalence of diabetes as the target variable, linear regression and random forest regression models were trained using AHRQ county features from 2015, 2016 and 2017. For linear regression a 5-fold cross validation was used for training and test data sets based on the top 30 features. For random forest regression all features were used as the algorithm will not overfit with a large number of features. Also, partitioning into training and test data sets is not necessary as random forest uses 2/3 of the data to grow each tree and the remaining 1/3 is used to calculate out-of-bag error to compute the model performance. To visualize the performance, scatter charts are provided showing the observed and predicted prevalence.

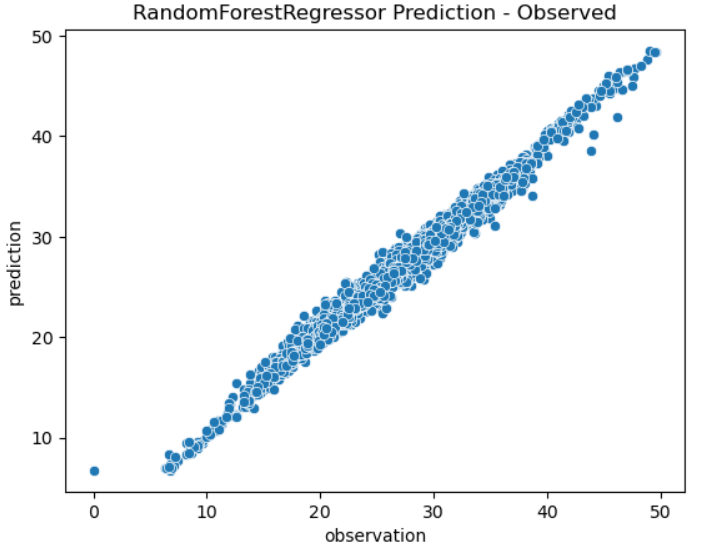
Random forest regression models the observations with very good performance compared to linear regression. This is probably due to the ability of random forest to capture non-linear relationships between the features and the target variable.
To further test performance the models trained on years 2015 – 2017 were used to predict 2018. This demonstrates the predictive potential on unseen, future data. The coefficient of determination (R²) scores for the tests are shown below:
| Linear Regression | Random Forrest Regression | |
| Years 2015 – 2017 | .73 | .98 |
| Year 2018 | .73 | .88 |
The R² score measures how well a statistical model predicts an outcome. It is the proportion of variance in the target variable that is explained by the model. A model with a score of 0 would always predict the average outcome, while a model with a score of 1 would make perfect predictions.
Note that the random forest regression does not model the data as well on a future year but still provides good performance.
Feature Analysis
The top ten features selected by random forest regression were compared to determinants analyzed in research literature on diabetes and SDOH. A study in Diabetes Care provides a comprehensive review of research on SDOH and Diabetes3Hill-Briggs F, Adler NE, Berkowitz SA, Chin MH, Gary-Webb TL, Navas-Acien A, Thornton PL, Haire-Joshu D. Social Determinants of Health and Diabetes: A Scientific Review. Diabetes Care. 2020 Nov 2;44(1):258–79. doi: 10.2337/dci20-0053. Epub ahead of print. PMID: 33139407; PMCID: PMC7783927. . The literature review focused on U.S. studies of adults with diabetes and SDOH subjects: socioeconomic status; neighborhood and physical environment; food environment; health care; and social context.
Socioeconomic Status
Diabetes prevalence and complications are linked to income, education, and occupation. The higher a person’s socioeconomic status, the less likely they are to develop Type 2 Diabetes or suffer from its complications. The top features in this category include:
- ACS_PCT_POSTHS_ED: Percentage of population with any postsecondary education (ages 25 and over).
- ACS_PCT_BACHELOR_DGR: Percentage of population with a bachelor’s degree (ages 25 and over).
- ACS_PCTLT_HS: Percentage of population with less than high school education (ages 25 and over)..
- ACS_MEDIAN_HOME_VALUE: Median home value of owner-occupied housing units (dollars).
- ACS_PCT_HU_ELEC: Percentage of occupied housing units with electricity heating.
Race was also identified as a feature:
ACS_PCT_WHITE_NONHISP: Percentage of non-Hispanic population reporting White race alone.
Studies on the interaction of individual poverty and neighborhood poverty discovered that poor adults living in nonpoor neighborhoods have an increased risk of diabetes, while poor adults living in poor neighborhoods have a twofold increased risk of diabetes. Poor Whites in poor neighborhoods had the highest odds of diabetes when compared to nonpoor Whites in nonpoor neighborhoods, followed by poor Blacks in poor neighborhoods and nonpoor Blacks in poor neighborhoods4Gaskin DJ, Thorpe RJ Jr, McGinty EE, et al., Disparities in diabetes: the nexus of race, poverty, and place. Am J Public Health 2014;104: 2147–2155.
Social Context
Social context include the factors: social capital; social cohesion; and social support. Social support describes individuals’ relationships as well as their perceptions of those relationships. Categories include emotional support, tangible support, informational support, and companionship. The top features include:
ACS_PCT_HH_KID_1PRNT: Percentage of family households with female or male householder, no spouse present.
Lack of social support has been correlated with increased diabetes mortality and related complications5Ciechanowski P, Russo J, Katon WJ, et al. Relationship styles and mortality in patients with diabetes. Diabetes Care 2010;33:539–544.
Physical Environment
Physical environment includes factors of housing, built environment, and environmental exposures. The top selected features include:
- NEPHTN_HEATIND_90: Total number of days with daily maximum heat index, absolute threshold: 90°F
- NEPHTN_HEATIND_95: Total number of days with daily maximum heat index, absolute threshold: 90°F
Individuals with Diabetes may be more vulnerable to the negative effects of heat (e.g., increased hospitalizations, increased occurrence of dehydration and electrolyte abnormalities, and higher mortality rate) than non-diabetics6Westphal SA, Childs RD, Seifert KM, Boyle ME, Fowke M, Iñiguez P, Cook CB. Managing diabetes in the heat: potential issues and concerns. Endocr Pract. 2010 May-Jun;16(3):506-11. doi: 10.4158/EP09344.RA. PMID: 20150024..
Healthcare
Healthcare as a SDOH includes access, affordability, and quality of care factors. Health care impacts levels of diabetes screening, diagnosis and treatment. The top selected features include:
ACS_PCT_PRIVATE_SELF_BELOW64: Percentage of population with direct-purchase health insurance only (ages 64 and below)
Diabetes patients’ health-care costs are 2.3 times higher than those of non-diabetics. Cost-related or cost-reduction nonadherence is linked to income, insured status, and insurance type7Kang H, Lobo JM, Kim S, Sohn M-W. Cost related medication non-adherence among U.S. adults with diabetes. Diabetes Res Clin Pract 2018;143:24–33.
Conclusion
In general, the analysis shows that widely available socio-demographic metrics can be used as both indicators and determinants of diabetes. And the important SDOH features predicting diabetes are supported by research literature on: socioeconomic status; neighborhood and physical environment; health care; and social context.
Although the machine learning models fit the data well for future years any extrapolation or future predictions should not be stretched too far from the ‘training’ data. Also, it should be noted that the populations for SDOH features data can be different from disease prevalence populations. Also, while the models use county socio-demographic metrics to accurately predict prevalence, care should be taken when making inferences that an individual with certain characteristics would have a higher or lower likelihood of diabetes.
Areas where prevalence diverges substantially from model predictions may help identify counties with best practices or counties in need of greater involvement and interventions to manage diabetes. Also, the important feature estimates for a county can be analyzed for areas of improvement.
The machine learning models can be used to predict diabetes prevalence before CMS chronic disease data is available. Note that AHRQ SDOH data is typically available before CMS chronic disease data.
References
- 1World Health Organization Global report on diabetes (who.int) (2016)
- 2National diabetes statistics report, 2020 : estimates of diabetes and its burden in the United States, National Center for Chronic Disease Prevention and Health Promotion (U.S.) https://stacks.cdc.gov/view/cdc/85309
- 3Hill-Briggs F, Adler NE, Berkowitz SA, Chin MH, Gary-Webb TL, Navas-Acien A, Thornton PL, Haire-Joshu D. Social Determinants of Health and Diabetes: A Scientific Review. Diabetes Care. 2020 Nov 2;44(1):258–79. doi: 10.2337/dci20-0053. Epub ahead of print. PMID: 33139407; PMCID: PMC7783927.
- 4Gaskin DJ, Thorpe RJ Jr, McGinty EE, et al., Disparities in diabetes: the nexus of race, poverty, and place. Am J Public Health 2014;104: 2147–2155
- 5Ciechanowski P, Russo J, Katon WJ, et al. Relationship styles and mortality in patients with diabetes. Diabetes Care 2010;33:539–544
- 6Westphal SA, Childs RD, Seifert KM, Boyle ME, Fowke M, Iñiguez P, Cook CB. Managing diabetes in the heat: potential issues and concerns. Endocr Pract. 2010 May-Jun;16(3):506-11. doi: 10.4158/EP09344.RA. PMID: 20150024.
- 7Kang H, Lobo JM, Kim S, Sohn M-W. Cost related medication non-adherence among U.S. adults with diabetes. Diabetes Res Clin Pract 2018;143:24–33
No responses yet