
Government agencies and civil organizations publish Social Determinants of Health (SDOH) data that can be used for research, predictive analytics and forecasting. SDOH data offers great potential for AI models, but there are numerous subject areas and measures that could be useful for a data science project. In this story we will show you how to quickly evaluate numerous public SDOH sources to determine the best features for your project.
As an example, we will show the best features for predicting the prevalence of mental health issues at the county level. Prevalence data is obtained from the CDC PLACES: Local Data for Better Health, County. SDOH features are obtained from the Agency for Healthcare Research and Quality (AHRQ). See Public SDOH Data Sources for an overview of the sources.
The source for the example is available on GitHub: SocialHealthAI/SDOH-Models.
Agency for Healthcare Research and Quality SDOH Data
The AHRQ repository is an excellent source for SDOH features. The ARHQ consolidates the sources into a single data structure. Geographic categories are provided for census tract, county and zip code. Measures are provided by counts and by ratios using populations. The repository structure and content is defined in AHRQ Data Source Documentation. Most of the data is based on surveys and include measures of:
- social factors
- health indicators
- health behaviors
Health indicators would not be used as SDOH factors, they would actually be used as targets of models. Health behaviors may or may not be considered as SDOH factors.
To help with extracting and preparing the data from the AHRQ repository you can use the data extract notebook: dataAHRQCountySDOH. The notebook extracts and cleans data and handles missing values. Any columns that are missing more than 30% are dropped and missing values are addressed using KNN Imputation.
You can call the data extract notebook from your notebook. First call the env1 notebook to establish the environment by installing any packages needed and define imports and extensions.
%run ../../environment/env1.ipynbThis also creates a text file to record the versions of packages you are using. Then call the dataAHRQCountySDOH notebook:
parm_AHRQCountySDOH_years = ['2020']

parm_AHRQCountySDOH_surveys = ["ACS", "AHA", "AMFAR", "CCBP", "CDCSVI", "CEN", "CRDC", "EPAA", "FARA", "FEA", "HHC", "HIFLD", "HRSA", "MHSVI", "MP", "NCHS", "NEPHTN", "NHC", "NOAAS", "POS", "SAHIE", "SAIPE", "SEDA"]

%run ../../etl/dataAHRQCountySDOH.ipynb
The first parameter defines a list of years to extract and the second parameter defines a list of surveys. See documentation in the dataAHRQCountySDOH notebook for more detail on the survey list. The notebook defines an output function which you can use to retrieve the dataframe of features.
dfAHRQCountySDOH = out_AHRQCountySDOH()The dataframe also has columns: ‘STATE’, ‘COUNTY’, ‘FIPS’, ‘YEAR’, feature 1, feature 2, …
Example: Features Predicting Mental Health Issues
We will show an example determining the best features for predicting the prevalence of mental health issues at the county level. The complete source can be found in the CDC_AHRQ_Mental_Health_Features notebook. Mental health data is obtained from the CDC PLACES: Local Data for Better Health, County (PLACES). The measure is based on the survey question “not good mental health for 14 or more days” for adults 18 years or older. For feature analysis, we will use the AHRQ repository described above.
We can extract and prepare the target data from PLACES using the data extract dataCDCPlaces notebook. First, set up the environment using the env1 notebook as described above. Then call the data extract notebook:
parm_CDCPlaces_years = ['2020']
parm_CDCPlaces_measure_id = 'MHLTH'
%run ../../etl/dataCDCPlaces.ipynb
dfCDCPlaces = out_CDCPlaces()
The notebook uses parameters for the list of years and the measure ID. And it provides a function to return a data frame with columns: MHLTH, YEAR, STATE, COUNTY, FIPS.
We extract data from the AHRQ repository as described above:
parm_AHRQCountySDOH_years = ['2020']

parm_AHRQCountySDOH_surveys = ["ACS", "AHA", "AMFAR", "CCBP", "CDCSVI", "CEN", "CRDC", "EPAA", "FARA", "FEA", "HHC", "HIFLD", "HRSA", "MHSVI", "MP", "NCHS", "NEPHTN", "NHC", "NOAAS", "POS", "SAHIE", "SAIPE", "SEDA"]

%run ../../etl/dataAHRQCountySDOH.ipynb
dfAHRQCountySDOH = out_AHRQCountySDOH()
We can then join the dataframes and create our training data:
dfMerged = pd.merge(dfAHRQCountySDOH, dfCDCPlaces, how='inner', left_on=['STATE','COUNTY', 'YEAR'], right_on = ['STATE','COUNTY', 'YEAR'])

X = dfMerged.drop(["MHLTH", "STATE", "COUNTY", "FIPS", "YEAR"], axis = 1)

Y = dfMerged["MHLTH"]
Feature Selection Using Random Forest
Random Forest is popular for determining feature importance. The algorithm can handle a large number of features and in this example the AHRQ extract has over 700 features. Random Forest has a low likelihood of over fitting. As random forest is based on an ensemble of decision trees, the classifier won’t overfit the model because the variance and prediction error are reduced overall by averaging uncorrelated trees.
Random Forest feature importance measures how much a feature helps the classification of the input samples. A greater percentage of the input samples are predicted accurately by features closer to the top of the tree than by features farther down the tree.
You can use the feature_RandomForestReg notebook for Random Forrest Regression feature importance. Input parameters provide the feature and the target dataframes.
parm_features_RandomForestReg_X = X # feature dataframe
parm_features_RandomForestReg_Y = Y # target dataframe
%run ../../features/features_RandomForestReg.ipynb
The notebook displays the top 30 features by order of importance.
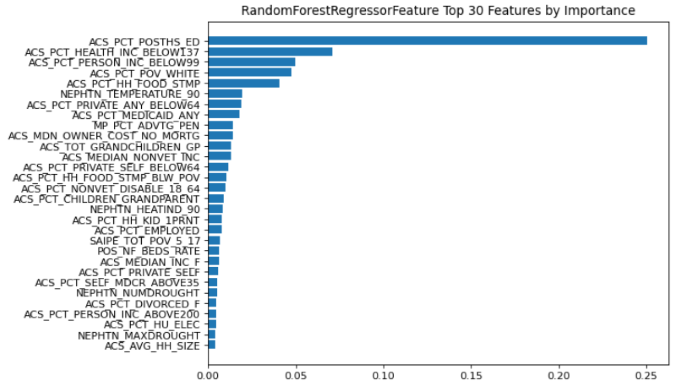
Most of the features are from the American Community Survey (see Public SDOH Data Sources). The top several features measure education and poverty. These features are consistent with studies of mental health and social determinants of health. For example, see 10 facts about mental health and poverty and Relationship between Education and Mental Health: New Evidence from a Discordant Twin Study.
We can retrieve the features using the output function:
listSelectedFeatures = out_features_RandomForestReg_X()We can also get an indication of the overall performance of the Random Forest algorithm by retrieving the R-squared score.
print("R2 Score: ", out_features_RandomForestReg_X_R2())The R-squared score is .89 indicating the data fits the regression model very well.
Feature Selection Using Mutual Information
Statistical tests can also be used for feature selection including: Mutual Information, Chi-Square Test, ANOVA F-Test and Regression t-Test. We will show the use of Mutual Information to determine the important features in the mental health example.
Mutual information is a measure of dependence or “mutual dependence” between two random variables. It is equal to zero if two random variables are independent and higher values indicate higher dependency. It is a univariate method so each feature’s dependence is calculated separately against the target. This is different from Random Forest as trees can capture interactions between variables.
You can use the feature_MutualInfoReg notebook for Mutual Information Regression feature selection. Input parameters provide the feature and the target dataframes.
parm_features_MutualInformationReg_X = X # features dataframe
parm_features_MutualInformationReg_Y = Y # target dataframe
%run ../../features/features_MutualInformationReg.ipynb
The notebook displays the top 30 features by order of importance.
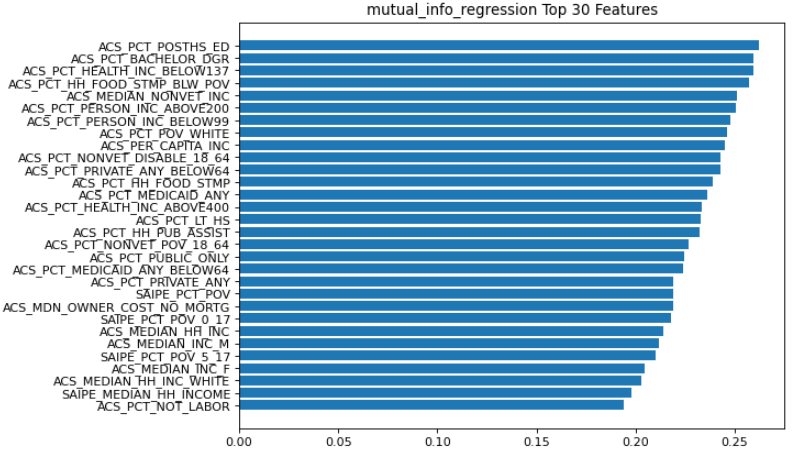
Like the important features identified by Random Forest Regression, most of the features are from the American Community Survey and the top several features measure education and poverty.
You can retrieve the top 30 features using:
listSelectedFeatures = out_features_MutualInformationReg_X()[0:30]Putting Selected Features to Work
Of course you will want to research the top features and the sources. It may be important to understand the populations used for different surveys and repositories.
Using top features will help with problems of model overfitting. Regression algorithms can suffer from overfitting when a large number of dimensions are used. Other algorithms like Random Forest and Boosted Trees will not overfit with a large number of dimensions but you can reduce processing and storage usage by using top features.
No responses yet